
How to Build a Financial Dashboard for Your Small Business
For many small business owners, financial data lives in multiple places—accounting software, spreadsheets, bank accounts, payroll systems. The result? Information overload without clarity.
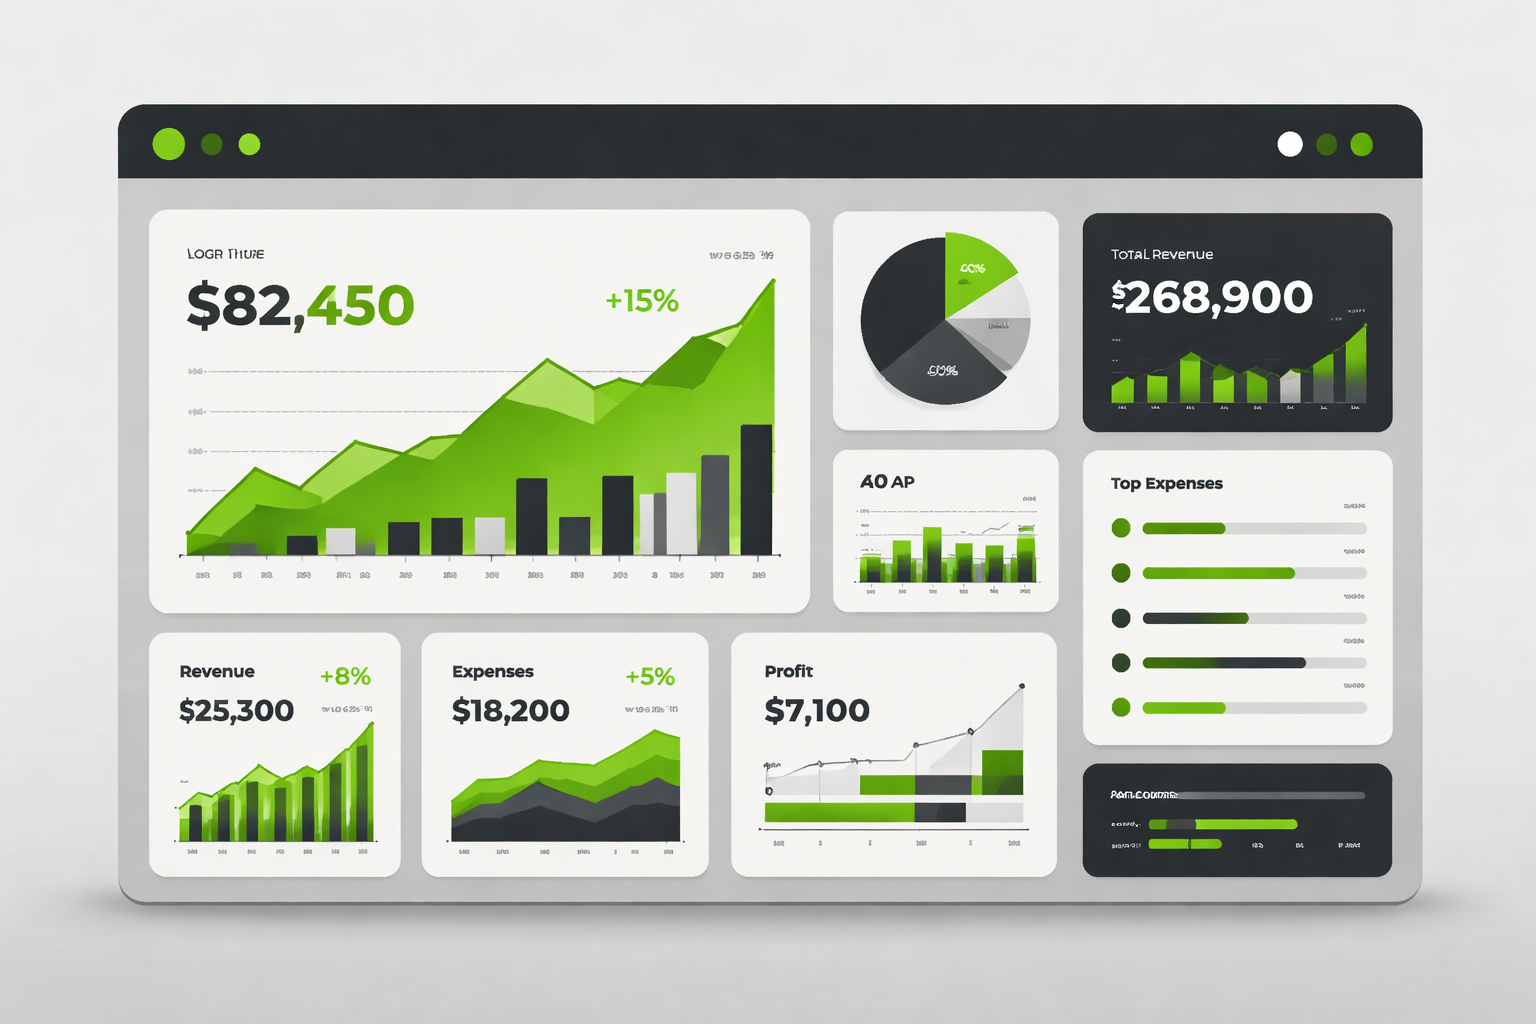
A financial dashboard solves this problem by bringing your most important numbers into one place, giving you a clear, real-time view of your business performance. Instead of reacting to issues after they happen, a well-built dashboard helps you monitor, plan, and make decisions proactively.
Here’s how to build a financial dashboard that actually works.
Step 1: Identify the Right Metrics
The biggest mistake small businesses make is trying to track everything. A strong dashboard focuses only on the metrics that drive decisions. Start with these core categories:
Revenue Metrics
Total revenue (monthly and year-to-date)
Revenue growth rate
Revenue by product, service, or client
Profitability Metrics
Gross profit
Net profit
Profit margin percentage
Cash Flow Metrics
Cash on hand
Monthly cash inflow vs outflow
Cash runway (how long you can operate with current cash)
Operational Metrics
Accounts receivable (what customers owe you)
Accounts payable (what you owe vendors)
Payroll as a percentage of revenue
These metrics give you a balanced view of performance, profitability, and liquidity.
Step 2: Keep It Simple and Actionable
Your dashboard should be easy to read in under five minutes. If it takes longer, it’s too complicated.
Focus on:
Clear visuals (charts, graphs, simple tables)
Consistent timeframes (monthly comparisons work best)
A limited number of KPIs (typically 8–12 total)
The goal is not to analyze every detail—it’s to quickly identify trends and take action.
Step 3: Use Reliable Data Sources
Your dashboard is only as good as your data. If your books are inconsistent or outdated, your dashboard will be misleading.
Ensure:
All accounts are reconciled
Transactions are categorized correctly
Financial reports are up to date
Your accounting system should be the primary data source. Avoid manually entering numbers into spreadsheets whenever possible to reduce errors.
Step 4: Choose the Right Tools
You don’t need complex software to build a useful dashboard. Many small businesses start with:
Accounting platforms (QuickBooks, Xero, etc.)
Spreadsheet tools (Excel or Google Sheets)
Dashboard tools (Power BI, Tableau, or built-in reporting tools)
The best tool is the one your team will actually use consistently.
Step 5: Add Comparisons and Trends
Numbers alone don’t tell the full story—context does.
Your dashboard should include:
Month-over-month comparisons
Year-over-year comparisons
Budget vs. actual performance
This helps you answer critical questions:
Are we improving or declining?
Are we meeting our targets?
Where are the gaps?
Step 6: Review It Regularly
A dashboard is not useful if it’s ignored. Set a consistent schedule to review your financials:
Weekly: cash flow and receivables
Monthly: full dashboard review
Quarterly: deeper strategic analysis
Regular reviews turn your dashboard into a decision-making tool rather than a static report.
Step 7: Tie It to Business Decisions
The most important step is using your dashboard to guide action.
For example:
Rising expenses → review vendors or pricing
Declining margins → adjust pricing or costs
Slow receivables → tighten collections process
Low cash runway → delay hiring or expenses
The Value of Financial Visibility
A well-designed financial dashboard gives small business owners something incredibly valuable: clarity.
Instead of guessing, you can:
Make informed decisions
Plan for growth
Identify risks early
It shifts your business from reactive to proactive management.
Building a financial dashboard doesn’t require complex systems or large teams. It requires a clear understanding of what matters most and a commitment to reviewing your numbers consistently.
For small businesses, this can be the difference between operating in the dark and running a business with confidence and control.
At Efficient Enterprise Solutions, we help businesses turn their financial data into clear, actionable insights—so you’re not just tracking numbers, you’re using them to grow.